# Explore Azure cost management with Tailpipe
> Leverage cost export data to understand and optimize your Azure cloud expenditures.
By Turbot Team
Published: 2025-09-22
Beyond using Tailpipe to examine cloud access and enhance security monitoring, it also serves as a powerful tool for investigating your Azure cost and usage information.
The newest iteration of the [Azure plugin](https://hub.tailpipe.io/plugins/turbot/azure) for Tailpipe now features tables dedicated to cost and usage analysis through your [Azure Cost and Usage Actual exports](https://learn.microsoft.com/en-us/azure/cost-management-billing/costs/tutorial-improved-exports). Together with the recently released [Azure Cost and Usage Insights Mod for Powerpipe](https://hub.powerpipe.io/mods/turbot/tailpipe-mod-azure-cost-and-usage-insights), you can generate insightful visualizations of your spending data using [Powerpipe](https://powerpipe.io).
## Configure and collect logs
Through the [Azure plugin](https://hub.tailpipe.io/plugins/turbot/azure), establish a [partition](https://tailpipe.io/docs/reference/config-files/partition) for organizing your cost and usage exports:
```hcl
connection "azure" "cost_account" {
tenant_id = "00000000-0000-0000-0000-000000000000"
subscription_id = "00000000-0000-0000-0000-000000000000"
client_id = "00000000-0000-0000-0000-000000000000"
client_secret = "my plaintext secret"
}
partition "azure_cost_and_usage_actual" "my_costs" {
source "azure_blob_storage" {
connection = connection.azure.cost_account
account_name = "storage_account_name"
container = "container_name"
}
}
```
After configuring the partition, initiate log collection.
```shell
tailpipe collect azure_cost_and_usage_actual
```
## Analyze your cost metrics
Following log collection, various queries help illuminate your spending. Here's an example showing monthly cost totals.
```sql
select
date_trunc('month', date) as month,
round(sum(cost_in_usd),2) as total_cost_usd,
from
azure_cost_and_usage_actual
group by
month
order by
month desc
```
```shell
+---------------------+----------------+
| month | total_cost_usd |
+---------------------+----------------+
| 2025-08-01 00:00:00 | 612.45 |
| 2025-07-01 00:00:00 | 584.12 |
| 2025-06-01 00:00:00 | 559.38 |
| 2025-05-01 00:00:00 | 533.90 |
| 2025-04-01 00:00:00 | 498.27 |
| 2025-03-01 00:00:00 | 472.15 |
+---------------------+----------------+
```
Interested in discovering your costliest services?
```sql
select
service_family,
round(sum(cost_in_usd),2) as total_cost_usd
from
azure_cost_and_usage_actual
group by
service_family
order by
total_cost_usd desc
limit 10;
```
```shell
+----------------------+----------------+
| service_family | total_cost_usd |
+----------------------+----------------+
| Virtual Machines | 245.73 |
| Storage | 182.64 |
| Networking | 120.58 |
| SQL Database | 95.34 |
| App Service | 76.12 |
| Cosmos DB | 54.87 |
| Key Vault | 32.19 |
| Kubernetes Service | 28.55 |
| Functions | 15.40 |
| Monitor | 8.73 |
+----------------------+----------------+
```
## Visualize in Powerpipe
Tailpipe queries excel at answering targeted cost questions, yet comprehensive spending analysis across time periods and categories calls for visual representations. The [Azure Cost and Usage Insights Mod for Powerpipe](https://hub.powerpipe.io/mods/turbot/tailpipe-mod-azure-cost-and-usage-insights) delivers specialized dashboards tailored for these analytical needs.
### Cost and Usage Report Overview
The [Overview](https://hub.powerpipe.io/mods/turbot/tailpipe-mod-azure-cost-and-usage-insights/dashboards/dashboard.cost_and_usage_actual_overview_dashboard) dashboard offers an extensive perspective on your cost and usage metrics. The view encompasses overall spending summaries featuring monthly and daily patterns, complemented by detailed cost distributions across subscriptions and regions.
### Cost by Service
To examine service-level expenses, the [Cost by Service](https://hub.powerpipe.io/mods/turbot/tailpipe-mod-azure-cost-and-usage-insights/dashboards/dashboard.cost_and_usage_actual_cost_by_service_dashboard) dashboard segments costs across different services. This analysis reveals your highest-cost Azure services within each subscription and presents comprehensive cost breakdowns per service.
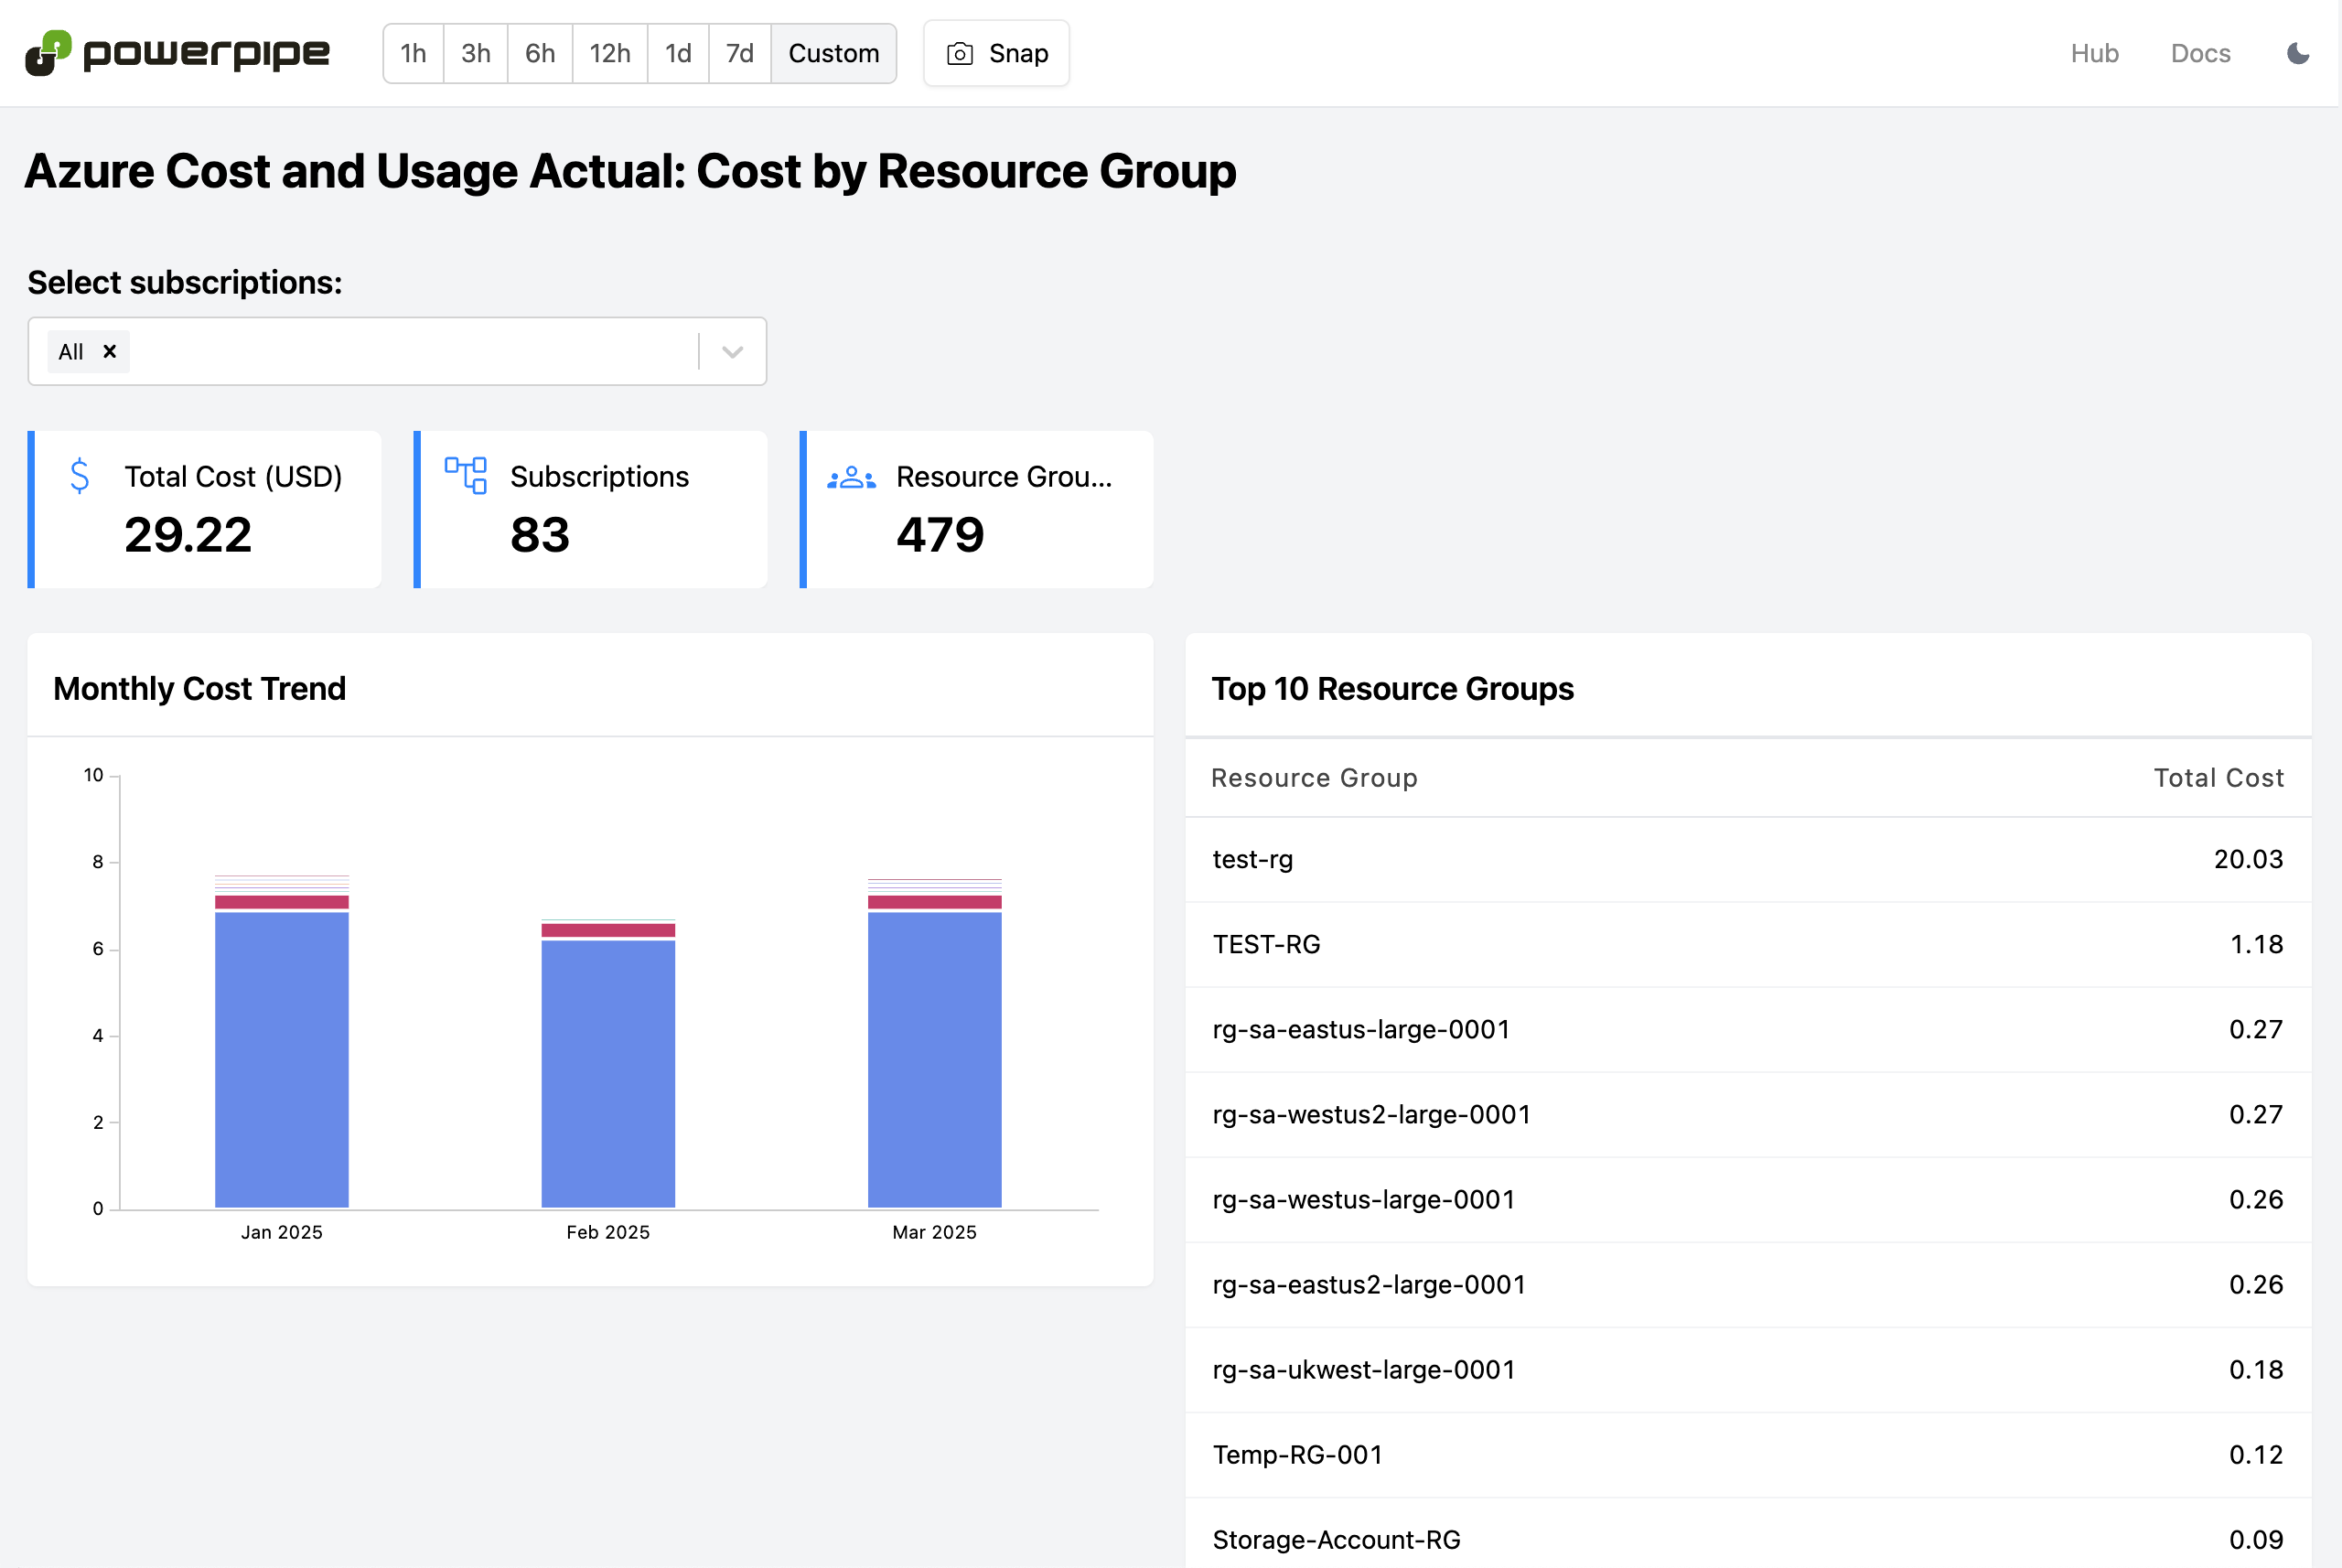
### Cost by Resource Group
Resource groups form the foundation of Azure resource organization and management. The [Cost by Resource Group](https://hub.powerpipe.io/mods/turbot/tailpipe-mod-azure-cost-and-usage-insights/dashboards/dashboard.cost_and_usage_actual_cost_by_resource_group_dashboard) dashboard enables you to track spending across different resource groups, making it simple to identify which departments, projects, or environments consume the most budget. This granular view helps teams understand cost allocation and supports chargeback scenarios where different groups need accountability for their Azure consumption.
## See it in action
## Start exploring your Azure cost and usage data
Both the [Tailpipe Azure Cost and Usage table](https://hub.tailpipe.io/plugins/turbot/azure/tables/azure_cost_and_usage_actual) and the [Powerpipe Azure Cost and Usage Insights Mod](https://hub.powerpipe.io/mods/turbot/tailpipe-mod-azure-cost-and-usage-insights) are currently available for implementation. Share your experiences with us through our [community forum](https://turbot.com/community/join)!