# Analyze GCP billing data with Tailpipe
> Query billing exports and create visual insights into your Google Cloud spending patterns.
By Turbot Team
Published: 2025-09-22
While many teams leverage Tailpipe for analyzing cloud access patterns and strengthening security posture, you can also harness its capabilities to examine your GCP cost and usage data in detail.
The most recent release of the [GCP plugin](https://hub.tailpipe.io/plugins/turbot/gcp) for Tailpipe incorporates tables that enable cost and usage analysis using your [BigQuery billing export data](https://cloud.google.com/billing/docs/how-to/export-data-bigquery). Combined with the new [GCP Cloud Billing Insights Mod](https://hub.powerpipe.io/mods/turbot/tailpipe-mod-gcp-cloud-billing-insights), you gain the ability to create visual representations of your spending patterns in [Powerpipe](https://powerpipe.io).
## Configure and collect logs
Using the [GCP plugin](https://hub.tailpipe.io/plugins/turbot/gcp), set up a [partition](https://tailpipe.io/docs/reference/config-files/partition) to handle your cost and usage information:
```hcl
connection "gcp" "billing_account" {
project = "my-gcp-project"
}
partition "gcp_billing_report" "my_billing" {
source "gcp_storage_bucket" {
connection = connection.gcp.billing_account
bucket = "gcp-billing-export-bucket"
}
}
```
Once this partition is in place, proceed to gather your logs.
```shell
tailpipe gcp_billing_report
```
## Query your spending data
After collecting the logs, you can execute queries to analyze your spending patterns. As an example, here's how to view total monthly costs.
```sql
select
DATE_TRUNC('month', usage_start_time) as month,
round(SUM(cost),2) AS total_cost,
currency
from gcp_billing_report
where cost IS NOT NULL
group by DATE_TRUNC('month', usage_start_time), currency
order by month DESC
limit 12
```
```shell
+---------------------+------------+----------+
| month | total_cost | currency |
+---------------------+------------+----------+
| 2025-04-01 00:00:00 | 14,457.98 | USD |
| 2025-03-01 00:00:00 | 17,286.9 | USD |
| 2025-02-01 00:00:00 | 15,093.38 | USD |
| 2025-01-01 00:00:00 | 15,277.61 | USD |
| 2024-12-01 00:00:00 | 14,908.98 | USD |
| 2024-11-01 00:00:00 | 14,542.62 | USD |
| 2024-10-01 00:00:00 | 16,095.58 | USD |
| 2024-09-01 00:00:00 | 15,784.81 | USD |
| 2024-08-01 00:00:00 | 3,677.85 | USD |
+---------------------+------------+----------+
```
Looking to identify your highest spending services?
```sql
select
service_description,
round(sum(cost),2) as total_cost,
currency
from
gcp_billing_report
group by
service_description,
currency
order by
total_cost desc
limit 10;
```
```shell
+------------------------------------+------------+----------+
| service_description | total_cost | currency |
+------------------------------------+------------+----------+
| Compute Engine | 75,466.94 | USD |
| Artifact Registry | 12,762.09 | USD |
| Cloud SQL | 12,681.29 | USD |
| Cloud Key Management Service (KMS) | 8,592.78 | USD |
| Cloud Filestore | 4,699.71 | USD |
| Cloud Logging | 4,041.34 | USD |
| Networking | 3,932.78 | USD |
| Kubernetes Engine | 2,410.64 | USD |
| Cloud Storage | 920.84 | USD |
| Binary Authorization | 283.09 | USD |
+------------------------------------+------------+----------+
```
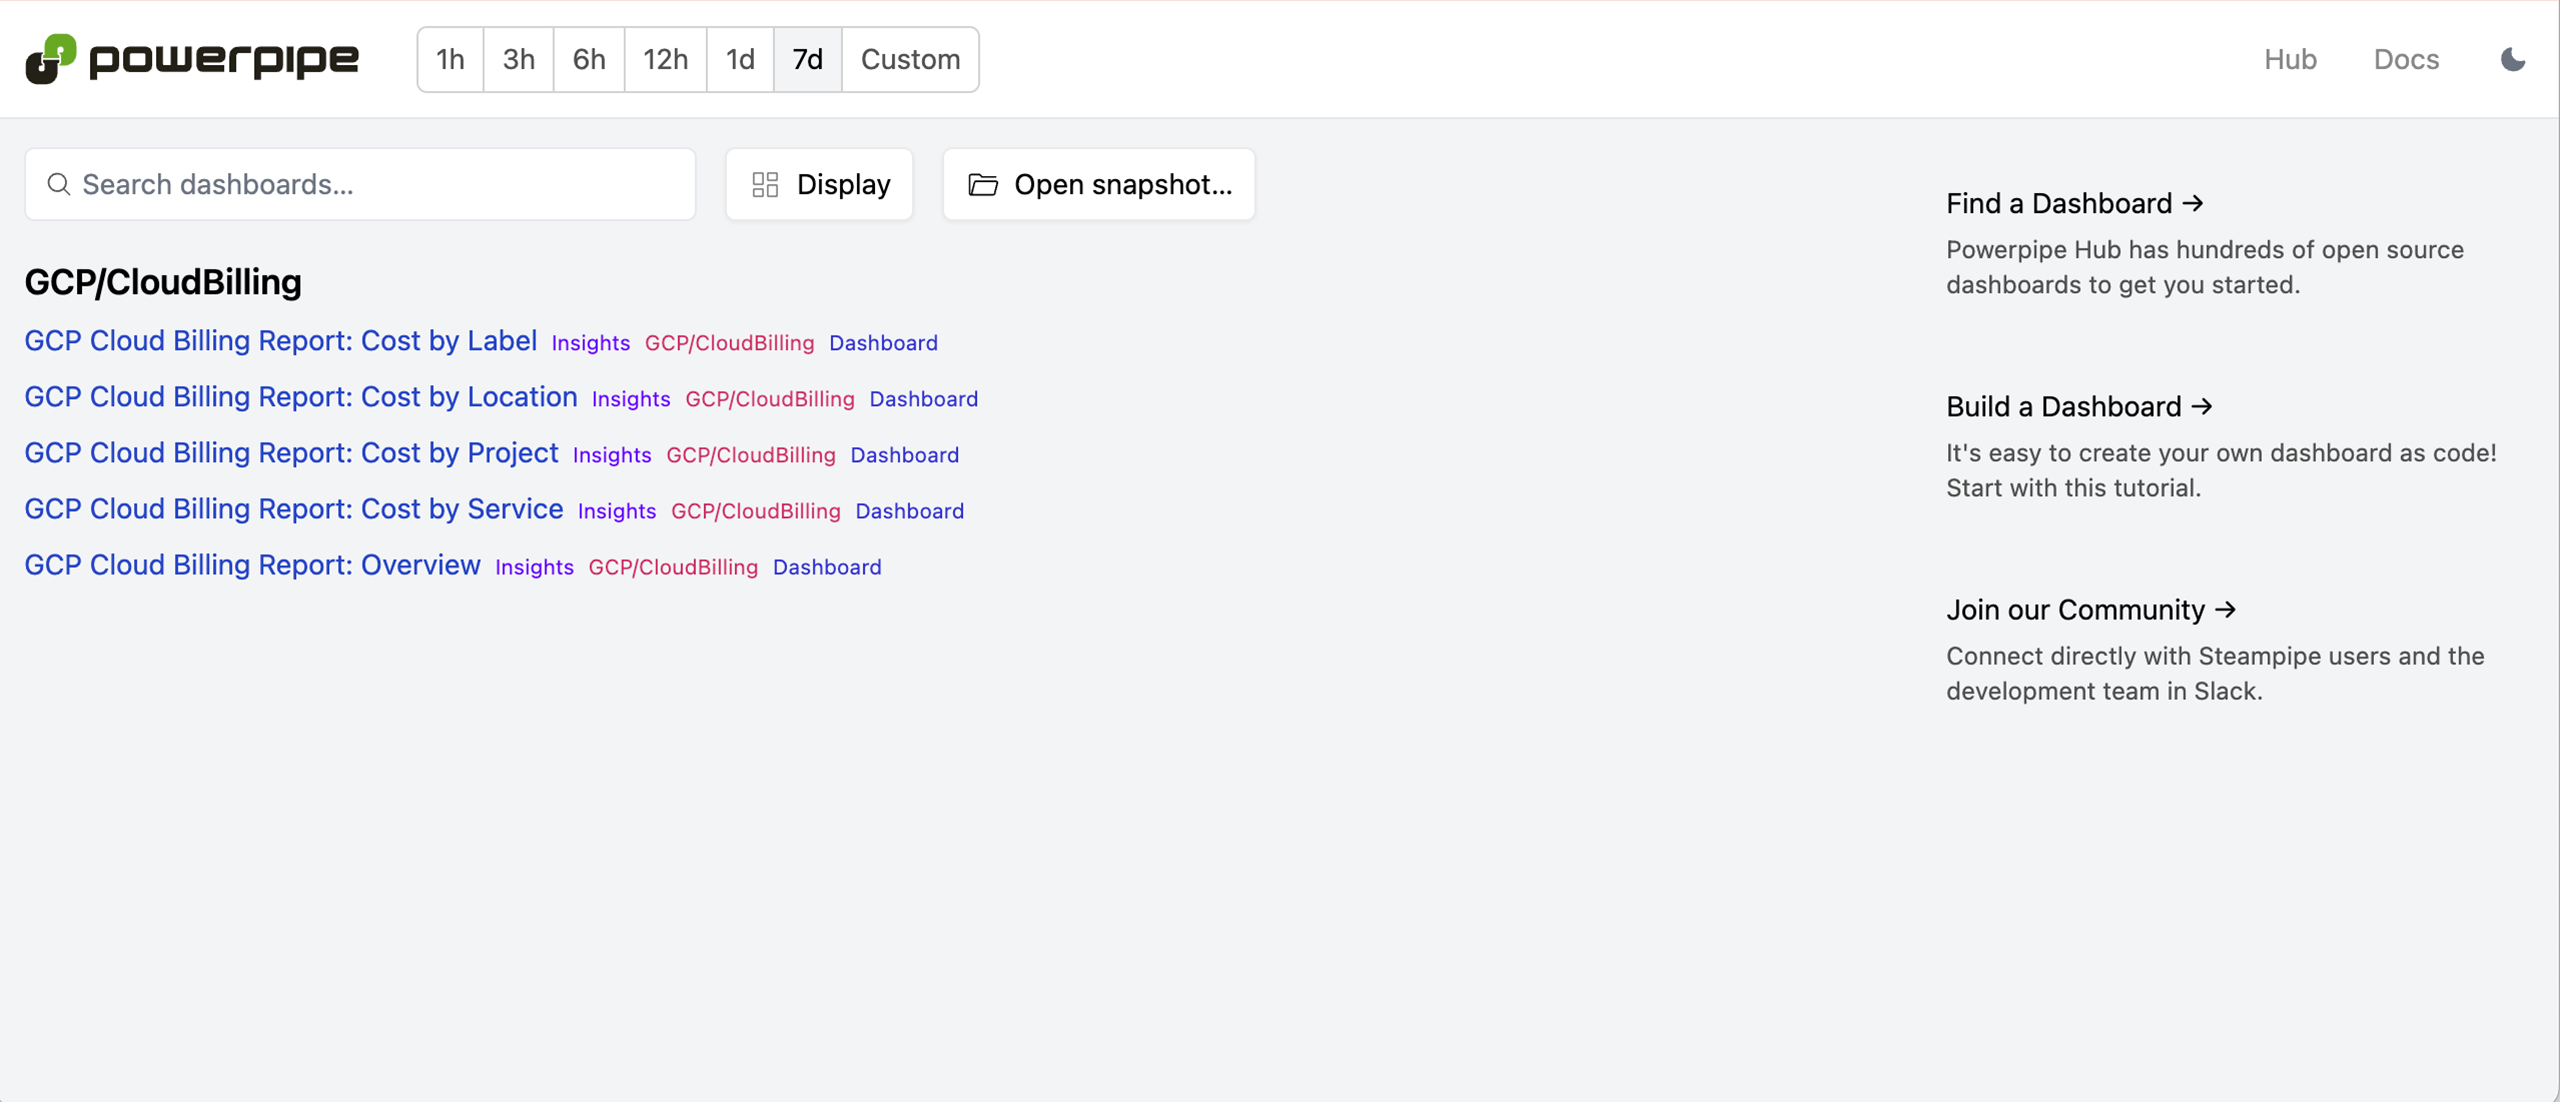
## Visualize in Powerpipe
While Tailpipe queries provide rapid insights into specific cost questions, deeper analysis of spending trends and patterns benefits from visualization. The [GCP Cloud Billing Insights Mod](https://hub.powerpipe.io/mods/turbot/tailpipe-mod-gcp-cloud-billing-insights) offers dashboards designed for this analysis.
### Cloud Billing Report Overview
The [Overview](https://hub.powerpipe.io/mods/turbot/tailpipe-mod-gcp-cloud-billing-insights/dashboards/dashboard.cloud_billing_report_overview_dashboard) dashboard delivers a comprehensive view of your spending and usage patterns. You'll find total cost summaries with both monthly and daily trends, plus detailed breakdowns across accounts and regions.
### Cost by Service
For service-specific cost analysis, the [Cost by Service](https://hub.powerpipe.io/mods/turbot/tailpipe-mod-gcp-cloud-billing-insights/dashboards/dashboard.cloud_billing_report_cost_by_service_dashboard) dashboard breaks down expenses by individual GCP services. This view helps pinpoint your most costly services while providing granular cost details for each one.
### Cost by Label
Labels provide essential organization and management capabilities for your GCP resources and projects. The [Cost by Label](https://hub.powerpipe.io/mods/turbot/tailpipe-mod-gcp-cost-usage-report-insights/dashboards/dashboard.cost_by_label_dashboard) dashboard displays total spending associated with specific project, resource, or system labels, breaking down costs by label values. This view also highlights the ten label values that drive the highest GCP expenses across your organization.
## See it in action
## Start exploring your GCP cost and usage data
The [Tailpipe GCP Billing Report table](https://hub.tailpipe.io/plugins/turbot/gcp/tables/gcp_billing_report) and the [Powerpipe GCP Cloud Billing Insights Mod](https://hub.powerpipe.io/mods/turbot/tailpipe-mod-gcp-cloud-billing-insights) are ready for use today. We'd love to hear your feedback in our community!