# Improved Tailpipe collection performance & control
> Explore Tailpipe's latest enhancements including precise date range controls, optimized hive partitioning for faster queries, configurable memory limits to prevent resource exhaustion, and automatic plugin crash detection with detailed reporting.
By Turbot Team
Published: 2025-07-02
We've been hard at work improving Tailpipe's performance, scalability, and usability. With the latest updates, you can now handle larger datasets more efficiently, collect data for specific time ranges, and get better visibility into your log collections.
## Collect data for any time range
Previously, you could only collect from a start date to "now". This made it difficult to backfill historical data or collect specific time periods for analysis.
Now you can specify both `--from` and `--to` flags to collect any time range with day-level granularity:
```shell
# Collect logs from a single day last week
tailpipe collect aws_cloudtrail_log.test --from T-5d --to T-4d
```
This is particularly useful for:
- Backfilling historical data without re-collecting recent logs
- Analyzing specific incident timeframes
- Processing data in controlled batches
The collection state management has been completely rewritten to handle overlapping time ranges intelligently, ensuring you don't re-collect data you already have. Previously, when specifying a `--from` date, the data would be *recollected*. Now, Tailpipe will only collect data that is missing from the specified time range, making it much more efficient for ongoing log collection.
If you would like to overwrite any existing data in that range, the `--overwrite` flag will do that.
## Reduced parquet file overhead
For large collections, having too many parquet files can significantly slow down both collection and querying. We've optimized the default partitioning strategy to dramatically reduce file counts while maintaining query performance.
By default, Tailpipe now uses a single "default" index instead of creating separate indexes for each account, organization, or other dimension. This can reduce the number of parquet files by 10x or more.
If you need custom indexing for your specific use case, you can still specify index fields in your partition configuration:
```hcl
partition "aws_cloudtrail_log" "test" {
source "aws_s3" {
connection = connection.aws.logs
bucket = "my-logs-bucket"
}
tp_index = "account_id" # Custom index field
}
```
For existing collections with many parquet files, the new `--reindex` flag for the `tailpipe compact` command will reindex your data using the current settings:
```shell
tailpipe compact aws_cloudtrail_log.test --reindex
```
## Better memory management for large datasets
We've implemented comprehensive memory controls that give you fine-grained control over resource usage; this provides the ability to fine-tune the memory usage for your own specific needs.
**CLI Memory Limits**: Set hard memory limits for the conversion process. When Tailpipe hits the limit, it automatically batches the work into smaller chunks:
```shell
export TAILPIPE_MEMORY_MAX_MB=2048 # Set a 2GB memory limit
```
**Plugin Memory Limits**: Soft memory limits for plugins help keep resource usage under control during data ingestion:
```shell
export TAILPIPE_PLUGIN_MEMORY_MAX_MB=512 # Set a 512MB memory limit for plugins
```
**Disk Space Throttling**: Prevent runaway collections from filling up your disk. Tailpipe will pause plugin operations when temp storage exceeds your specified limit:
```shell
export TAILPIPE_TEMP_DIR_MAX_MB=1024 # Set a 1GB limit for temporary storage
```
These controls work together seamlessly. You can now set a memory limit as low as 1GB and Tailpipe will adapt, batching the work appropriately. In many cases, setting reasonable memory limits actually improves performance by reducing system swapping.
## Enhanced introspection and debugging
We've improved the introspection commands to make it easier to understand and debug your Tailpipe configurations:
### Source properties
```shell
$ tailpipe source show aws_s3_bucket
Name: aws_s3_bucket
Plugin: hub.tailpipe.io/plugins/turbot/aws@latest
Properties:
bucket: string (required)
file_layout: string
Grok pattern to use to parse the file layout and extract metadata
patterns: map[string]string
Grok patterns to add to the grok parser used to parse the layout
prefix: string
```
### Location tracking
Know exactly the origin of each format — whether it's a built-in preset exposed by a plugin or a user-defined format from a local config file. This helps you distinguish between preset and custom formats, identify the responsible plugin, and understand where changes should be made.
```shell
$ tailpipe format list
TYPE NAME LOCATION DESCRIPTION
aws_vpc_flow_log - hub.tailpipe.io/plugins/turbot/aws@latest This is a format type, it can be used for defining instances of formats.
aws_vpc_flow_log default hub.tailpipe.io/plugins/turbot/aws@latest The default format for an VPC Flow Log.
delimited - hub.tailpipe.io/plugins/turbot/core@latest This is a format type, it can be used for defining instances of formats.
delimited access_log /Users/pskrbasu/.tailpipe/config/custom.tpc
delimited default hub.tailpipe.io/plugins/turbot/core@latest Default Delimited format
grok - hub.tailpipe.io/plugins/turbot/core@latest This is a format type, it can be used for defining instances of formats.
grok steampipe_plugin /Users/pskrbasu/.tailpipe/config/formats.tpc
jsonl - hub.tailpipe.io/plugins/turbot/core@latest This is a format type, it can be used for defining instances of formats.
jsonl default hub.tailpipe.io/plugins/turbot/core@latest Default JSONL format
nginx_access_log - hub.tailpipe.io/plugins/turbot/nginx@latest This is a format type, it can be used for defining instances of formats.
nginx_access_log combined hub.tailpipe.io/plugins/turbot/nginx@latest Predefined Nginx combined log format.
regex - hub.tailpipe.io/plugins/turbot/core@latest This is a format type, it can be used for defining instances of formats.
```
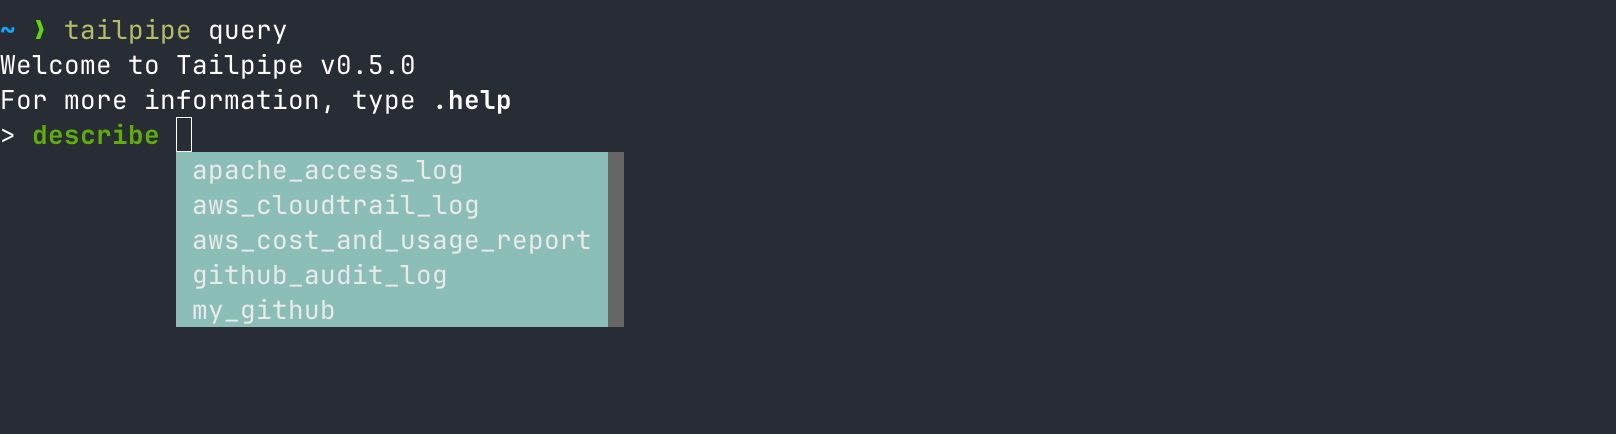
### Better autocomplete
Table names now autocomplete in DB meta queries, making it easier to write queries without needing to remember exact table names.
### Cleaner inspect output
More readable formatting for configuration inspection. Tailpipe specific `tp_*` columns are now sorted together at the end of the output, making it easier to focus on the core data structure.
```shell
$ tailpipe query
Welcome to Tailpipe v0.5.0
For more information, type .help
>
> .inspect access_log
Column Type
ip_address varchar
rowid bigint
status_code integer
timestamp timestamp
user_agent varchar
tp_akas varchar[]
tp_date date
tp_destination_ip varchar
tp_domains varchar[]
tp_emails varchar[]
tp_id varchar
tp_index varchar
tp_ingest_timestamp timestamp
tp_ips varchar[]
tp_partition varchar
tp_source_ip varchar
tp_source_location varchar
tp_source_name varchar
tp_source_type varchar
tp_table varchar
tp_tags varchar[]
tp_timestamp timestamp
tp_usernames varchar[]
>
>
```
## Improved error handling and plugin crash detection
When plugins crash due to memory issues or other problems, Tailpipe now detects the failure immediately and provides clear error messages instead of hanging indefinitely. The CLI monitors communication with plugins and terminates collection gracefully when issues occur.
## See it in action
## What's next?
These improvements lay the groundwork for even better performance and usability. We're continuing to optimize memory usage, improve error handling, and make Tailpipe more efficient for large-scale log analysis.
Have you been hitting memory limits or struggling with large datasets? [Download the latest Tailpipe](https://tailpipe.io/downloads) and let us know how these improvements work for your use case!